

What do benthic macroinvertebrates and algae tell us about stream health?
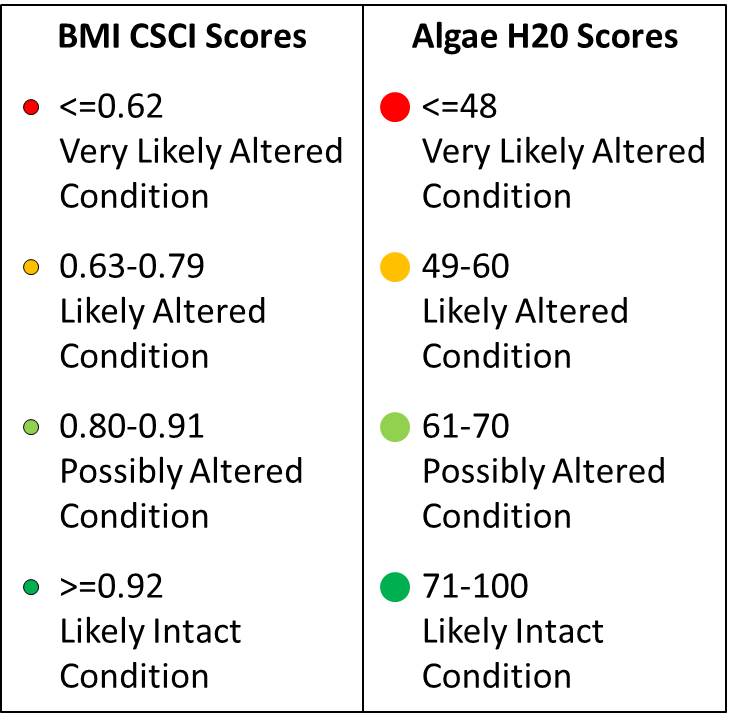
Living organisms integrate the effects of multiple stressors such as sedimentation, nutrient enrichment and riparian disturbance, over both space and time. The California Stream Condition Index (CSCI) is a statewide biological scoring tool that helps aquatic resource managers translate complex data about bugs or “benthic macroinvertebrates” (BMIs) living in a stream into an overall measure of stream health. The CSCI score is a measure of how well a site’s observed condition matches its predicted or expected condition. Expected values of a set of ecological indicators are predicted using statistical models. Algae serve as another indicator of stream ecological condition because they respond most directly to nutrients. The hybrid algae index, “H20”, is comprised of eight metrics that are based on diatoms, soft algae, and/or relative species numbers. The H20 index was developed for southern California coastal streams, so it may be inappropriate for use elsewhere in the state. A statewide algae index is currently under development and is projected to be available by 2018.
This map displays the monitoring sites statewide that have California Stream Condition Index (CSCI) scores calculated and/or have the stream algae scores calculated using the southern California index based on diatoms and soft algae (H20). The sites displayed are for the most recent date a sample was collected. Many sites have multiple samples, but this map shows only the single sample from each site that is the most recent sample date. This map includes probabilistic sites (randomly selected site that represents a known length of stream that is used to infer conditions about a large geographic region) and targeted sites (fixed site near location of special interest). These sites come from the Perennial Streams Assessment (PSA), Reference Condition Management Program (RCMP), Southern Stormwater Monitoring Coalition (SMC), US Forest Service, and Regional Water Board bioassessment monitoring programs. The sites displayed were sampled from 1999 through 2015 for CSCI scores and from 2008 through 2015 for H20 scores.
Note: the categories and data in the map and download file are for statewide assessment purposes only. They are not to be used for regulatory purposes.
