

Elements of Wetland and Riparian Area Monitoring Plan (WRAMP)
Key Definitions
What are Monitoring and Assessment?
WRAMP can be used for assessment and monitoring. An assessment is an observation or report of condition for one area and time period based on monitoring results. An initial assessment based on an initial monitoring effort establishes a baseline measure of condition. Monitoring can also mean a series of repeated assessments, as needed to assess changes in condition over time. Repeated monitoring is essential to assess temporal trends in the condition of wetlands and streams.
What is the Relationship of Monitoring and Assessment to Research?
WRAMP distinguishes monitoring and assessment from research. Monitoring and assessment reveal patterns of change in condition that are the basis for formulating hypotheses of causal relationships that are tested by research. In short, monitoring and assessment reveal how conditions change, whereas research explains why. WRAMP can be adapted to research by incorporating the element of experimental design.
What are the Kinds of Monitoring Supported by WRAMP?
WRAMP is intended to be used for at least three basic kinds of monitoring, as described below.
- Compliance Monitoring. Agencies at all levels of government need to know if their permittees, grantees, and contractors who are required to protect wetlands and streams are complying with their permits and meeting their objectives. This is generally referred to as compliance monitoring, and it usually pertains to projects.
- Effectiveness Monitoring. Government agencies that need compliance monitoring also need to know if their policies, programs, and projects are achieving their long-range goals. This is generally referred to as effectiveness monitoring.
- Ambient Monitoring. Monitoring is also needed to increase common knowledge about the status and trends in wetlands and streams, as affected by large-scale, pervasive forces of environmental change, such as the economy, human demography, and climate. This monitoring is essential to explain shifts in baseline conditions, and is generally referred to as ambient monitoring. Assessments of compliance and effectiveness rely on ambient monitoring to distinguish the likely effects of large-scale, pervasive forces from the likely effects of policies, programs, and projects.
What is a Project?
Projects are on-the-ground efforts to improve or protect the abundance, diversity, or condition of wetlands or streams. The WRAMP toolset can be applied to four kinds of projects:
- Permitted impacts to wetlands or streams;
- Compensatory mitigation projects (see US EPA description of compensatory mitigation);
- Non-compensatory projects to create, restore, or enhance wetlands or streams;
- Wetland and stream monitoring and research projects with field sites that are not related to the other three project types.
In the context of regulatory review, projects are often defined according to the definition of project in the California Environmental Quality Act.
What is the Watershed or Landscape Approach?
WRAMP is designed to support monitoring and assessment of wetlands and streams, including projects, in a watershed or landscape context.
A landscape is defined as a heterogeneous land area characterized by self-similar, persistent mosaics of interacting land uses or habitat types. In other words, landscapes tend to be visually self-evident. Examples of landscapes include large deltas (e.g., the Sacramento-San Joaquin Delta), large valleys (e.g., Round Valley, Sierra Valley, and self-similar areas of the Sacramento Valley), and large plains (e.g., the Santa Rosa Plain, Vina Plain, Carrizo Plain). The size of a landscape is determined by the dimensions of its repeating mosaics of land use or habitats.
Watersheds are defined as areas draining to a common place, as evident in the USGS Watershed Boundary Dataset, or as demarcated using either the USGS StreamStats tool, or the Landscape Profile Tool of the California EcoAtlas.
WRAMP broadly supports the watershed or landscape approach to aquatic resource monitoring and assessment, as well as the watershed approach, to mitigation planning called for by Regional Compensatory Mitigation and Monitoring Guidelines of the US Army Corps of Engineers (USACE) in coordination with USEPA. A video produced by USACE that helps explain these new guidelines is available online.
WRAMP incorporates tools designed to implement the watershed or landscape approach to project siting and design, project tracking, project assessment, aquatic resource mapping, ambient monitoring design, and synthesis and reporting of aquatic resource condition.
- Project Siting and Design. WRAMP incorporates tools for siting and designing aquatic resource projects that explicitly consider interactions between the projects and watershed processes, economics, landscape ecology, and other projects. Example tools include RIOS, RiverRAT, NatureServe Vista, Habitat Priority Planner, and the Landscape Profile Tool of the California EcoAtlas. Such tools are not interchangeable. They have different objectives, input data, and outputs. Care must be taken to select tools that meet project-specific conditions and needs.
- Project Tracking. WRAMP incorporates web-based inventories of projects that enable all interests to visualize past, present, and proposed projects in a watershed or landscape context. Two such tools are being implemented in California at this time, the Conservation Action Tracker and the Project Tracker of the California EcoAtlas.
- Project Assessment. The WRAMP toolset includes tools and methodologies for assessing projects in the landscape or watershed context. For example, the California Rapid Assessment Method (CRAM) considers the landscape surrounding projects. The Riparian Zones Estimator Tool yields synoptic measures of functional riparian areas for entire watersheds, and can be used to assess the effects of projects on riparian extent.
- Aquatic Resource Mapping. WRAMP incorporates the Californian Aquatic Resource Inventory (CARI) as a common basemap for tracking and assessing wetlands and streams throughout the state. The Landscape Profile Tool of the California EcoAtlas summarizes information about the abundance, diversity, and condition of wetlands, streams, riparian areas and related information in automated reports for user-defined areas.
- Ambient Monitoring Design. WRAMP incorporates both probabilistic and targeted sampling designs, using the Californian Aquatic Resource Inventory (CARI) within the boundaries of watersheds or landscapes as sample frames.
- Synthesis and Reporting. WRAMP features the California EcoAtlas for aggregating information about aquatic resources from many sources and summarizing them into automated reports for user-defined landscapes and watersheds using the Landscape Profile Tool.
WRAMP Diagram and Guidance
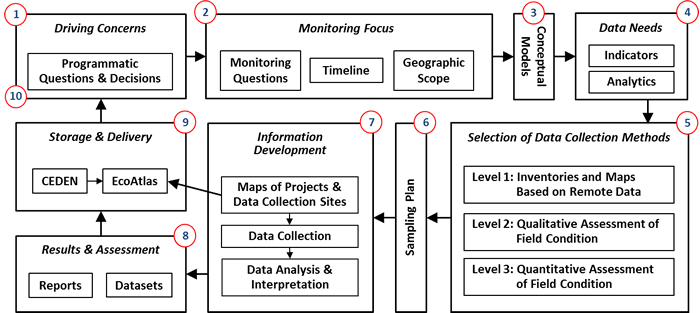
The WRAMP Diagram lays out the major elements of WRAMP as 10 steps that should be considered in sequence. The diagram applies equally well to impact assessment, compliance monitoring, effectiveness monitoring, and ambient monitoring. It can be adapted to research by incorporating the element experimental design (Step 3). Key definitions are described above and a discussion of the watershed or landscape approach to monitoring aquatic resources are provided in the WRAMP Overview on the CWMW website.
Users of WRAMP should read through the text for each step of the WRAMP Diagram. While users might choose to focus on one element of WRAMP, they will benefit from knowing how the elements relate to each other. The WRAMP Diagram can also be used as a checklist to make sure all the elements of a monitoring plan have been adequately considered.
Step 1: Driving Concerns
The first step in the WRAMP Framework is to understand exactly why monitoring and assessment are needed. The WRAMP Framework therefore begins with one or more clearly-stated programmatic, regulatory, or management questions or decisions that cannot be addressed without new information from assessing the aquatic resources at one or more points in time. There is commonly a need to repeatedly revisit the concerns until they are defined well enough to be translated into Monitoring Questions (Step 2). Some typical concerns are presented below:
- Project Compliance. Typical concerns are about how a proposed project might affect the condition of aquatic resources; to what degree a project was completed as planned and permitted; to what degree a project has yielded its intended product or other outputs; and to what degree a project has met its performance criteria. Concerns might vary among these criteria, and might therefore give rise to multiple monitoring questions, which in turn may need to be prioritized.
- Project Effectiveness. Typical concerns are about the degree to which a project has achieved intended goals or other long-term outcomes. Such concerns might vary among the various project goals, and might therefore give rise to multiple monitoring questions, which in turn may need to be prioritized.
- Ambient Condition of Aquatic Resources. Typical concerns are about the status and trends in overall abundance, diversity, or condition of aquatic resources within a prescribed area; to what degree policies and programs are achieving their missions; and how policies and programs might be adjusted to improve their effectiveness.
Step 2: Monitoring Focus
Monitoring and assessment gain focus by translating the driving concerns into monitoring questions, determining the timeline for answering the questions, and defining the geographic scope of the monitoring effort.
- Monitoring Questions. The WRAMP Framework is largely about developing information through monitoring and assessment to directly address the Driving Concerns (Step 1). This requires translating the concerns into one or more discreet monitoring questions. A monitoring question is well enough developed when it clearly guides the identification of indicators (i.e., what to measure), the selection or development of methods to collect and analyze the data, and their final formatting to address the Driving Concerns.
- Timeline. The timeline for monitoring and assessment should reflect the timeline for addressing the Driving Concerns, as represented by regulatory and management questions and decisions, and is usually tied to budgetary or statutory deadlines that should be respected.
- State and federal water quality permits require an assessment of project impacts to wetlands and streams and to wildlife using those resources.
- Most state and federal water quality permits issued to long-term projects or maintenance programs affecting aquatic resources are reviewed on five-year cycles and usually require monitoring and assessment.
- Permits for short-term projects generally require compliance monitoring of project restoration requirements.
- Grants and contracts for projects typically last for one to three years and can require monitoring to show progress toward goals and objectives, in addition to the compliance monitoring required by permits.
- Monitoring intended to support decisions affecting policies, programs, and projects must be geared to the timeline for the decisions. Some state and federal programs relating to aquatic resource protection produce triennial reviews.
- The timeline for the driving decisions to be made or questions to be answered can constrain the monitoring period, which in turn can constrain the breadth and depth of the monitoring effort. The monitoring plan must be tailored to the available monitoring period.
- All monitoring must fully consider the seasonal nature of factors and processes to be monitored, and must also consider how their seasonal or inter-annual variability may affect the statistical variance of the monitoring results and hence their precision.
- Geographic Scope. The approach to defining the geographic scope will differ for ambient assessments and project assessments. For ambient assessments, the approximate scope can be inferred from the ambient monitoring question. The scope can be mapped as a set of contiguous 12-digit Hydrological Units (i.e., HUC-12 watersheds) of the USGS Watershed Boundary Dataset. HUC-12 watersheds range in size from about 10,000 to 40,000 acres. Therefore, large-scale ambient assessments can involve many HUC-12 watersheds.
For project assessments, the geographic scope should be the spatial extent of the project. However, in order to consider the effects of landscape or watershed processes on project siting, design, maintenance, and monitoring, the project landscape or watershed should also be identified. The project watershed should be the set of HUC-12 watersheds draining directly to the project. The project landscape must be identified based on the landscape definition presented as part of the watershed or landscape approach. In some cases, the landscape approach to ambient assessment is more appropriate than the watershed approach. For example, a well-defined landscape could be the subject of the assessment. Examples of WRAMP-based ambient assessments of watersheds and landscapes include:
Step 3: Conceptual Modeling
For the purposes of WRAMP, conceptual models are tools for identifying the factors and processes that must be monitored to address the driving questions or decisions. The models should focus on cause-and-effect relationships that can strongly affect the monitoring results. Box and arrow models are recommended, where the boxes represent factors and the arrows represent their interrelationships. The models should reflect what is known as scientific fact, what can be extrapolated from the facts, and what is likely based on consensus professional judgment. The models should indicate which of these three levels of scientific certainty applies to each interrelationship. All the major assumptions of the models should be documented.
Research to explain monitoring results can be added to the WRAMP framework at this step. The conceptualized relationships among the various factors included in the models can be translated into testable hypotheses. Additional conceptual modeling would then be needed to design the test. The hypotheses might also be developed at Step 1; the driving question could be about the causes of reported monitoring results. In this case, the conceptual modeling would only be to identify factors and processes to measure when testing the hypothesis, rather than for monitoring.
Step 4: Data Needs
Needed data are identified based on the timeline (Step 2) and the conceptual modeling (Step 3). In essence, the needed data represent factors that the models suggest are most directly related to the monitoring questions and hence the Driving Concerns (Step 1). The different kinds of needed data can be termed indicators. An indicator might consist of one variable, such as stream flow or plant cover, or it might be an index, such as CRAM, that consists of multiple variables.
An indicator can represent one or more aspects of condition or stress. A stressor is defined as any physical, chemical, or biological factor that can negatively impact the abundance, diversity, or condition of an aquatic resource (including stream and wetland plants, animals, habitats, and ecosystems). In general, stressors are monitored to help explain condition. The relationships between stressors and condition are seldom well understood, however, and including stressors in a monitoring effort can greatly increase its costs. For these reasons, monitoring should focus on condition. If monitoring reveals that conditions are declining, stressors can be added to the monitoring plan to help understand the declines. Special studies to experimentally test conceptualized relationships between stress and condition are an alternative to monitoring stressors.
Lagging indicators are used to assess existing conditions or stress, whereas leading or predictive indicators are used to assess likely future conditions. Leading indicators are usually based on well-known cause-and-effect relationships represented by the conceptual models (Step 3). Some indicators can be lagging indicators in some regards, and predictive indicators in other regards. For example, the hydrograph of a stream or the hydroperiod of a wetland may serve to indicate existing hydrological conditions, and to predict future conditions for related factors such as stream stability or wetland plant community structure. The selected indicators should be classified as lagging or leading, based on the conceptual modeling (Step 3).
Analytics refers to the graphic and statistical methods of data analysis that will be used to summarize the monitoring results and prepare them for interpretation (Step 8). It’s important to select the analytics during the identification of data needs to make sure that all the data needed for the analyses are collected during monitoring. The analytics should include procedures for data quality assurance and quality control (QAQC). QAQC procedures have been prepared for data collection methods adopted by the Surface Water Ambient Monitoring Program (SWAMP), and are available online.
Step 5: Classification of Data
Every kind of data, indicator, and method of data collection used to assess wetlands and streams can be classified into one of three categories or levels, based on the three-level classification system developed by the USEPA.
Step 5 is accomplished by asking the following question: how can the driving question or decision be addressed using Level 1 (L1) methods, Level 2 (L2) methods, and/or Level 3 (L3) methods? Level 1-3 data are often integral components of a monitoring plan. For example, L1 maps of the aquatic resources or project(s) to be assessed can serve as the sample frame for data collection using L2 or L3 methods. In some cases, strong positive correlation between L2 and L3 data can justify using less expensive L2 methods as proxies for L3 methods.
In general, monitoring costs increase with the level of monitoring data and methods. It is essential to explore how L1-L3 methods can be used to meet the data needs identified in Step 4, with an emphasis on maximizing the use of existing data and new L1 and L2 data. Each requirement for new L3 data should be carefully rationalized to account for their relatively high cost. The differences between L1-L3 methods and data are explained below. WRAMP can include additional L1-L3 SOPs that involve statewide technical advisory committees, rigorous field testing, and vetting with intended user communities.
Level 1 (L1). L1 includes maps and other inventories and databases for environmental information, plus the data and indicators provided by these sources, as well the methods to create them. L1 methods are necessary to answer driving questions about the location, distribution, abundance and diversity of aquatic resources and related projects in the watershed or landscape context. Some existing L1 tools for assessing wetlands and streams are listed below:
- California EcoAtlas. EcoAtlas provides free access to information for effective aquatic resource management. The maps and tools can be used to create a complete picture of wetlands and streams in the landscape or watershed context by integrating stream and wetland maps, project information, and monitoring results with land use, transportation, and other information. EcoAtlas helps access, visualize, and summarize information about the distribution, abundance, diversity, location, and condition of California wetlands, streams, and riparian areas.
- California Aquatic Resource Inventory (CARI). CARI is a standardized statewide map of surface waters, including tidal areas, wetlands, rivers, streams, and lakes. CARI v0 is a compilation of the best available digital maps, including the National Hydrography Dataset (NHD) of the USGS , the National Wetland Inventory (NWI) of the USFWS , as well as maps produced by regional and local agencies. The CARI Standard Operating Procedure (SOP) provides detailed instructions for mapping and classifying surface waters consistent with standards provided by Federal Geographic Data Committee (FGDC) and with enough detail and accuracy to inform local land use plans. CARI includes an online editing tool to help assure that CARI remains current. CARI serves as the base map for EcoAtlas, and other L1 tools, including Project Tracker and the Landscape Profile Tool.
- California Environmental Data Exchange Network CEDEN. CEDEN is the data management system used by the State Water Resources Control Board for surface water quality in California. Anyone can access CEDEN data online, or submit new data through one of the regional data centers.
- Project Tracker. This is a tool within the California EcoAtlas that supports mapping, tracking, and reporting on projects. Maps of projects can be uploading or developed online, through heads-up, on-screen digitizing. The project maps serve as file folders for uploading and accessing project information, including images, movies, links to websites, reports and flat files of monitoring data. The tool can be expanded to incorporate monitoring and research field sites as a category of projects.
- Landscape Profile Tool. This is a tool within the California EcoAtlas that summarizes existing information about aquatic resources and related information into standardized reports for any user-defined area of California, and for selected pre-determined areas, including counties, congressional districts, and HUC12 watersheds. The Landscape Profile Tool currently incorporates information from CARI, Project Tracker, the California Natural Diversity Database, National Land Cover Database, US Census, the CRAM database, and the California Environmental Data Exchange Network. Access to additional datasets will be provided in the future to serve state and federal aquatic resource protection programs.
- Riparian Zone Estimation Tool (RipZET). RipZET is a modular modeling tool that operates in a GIS on a basemap of aquatic resources, such as the California Aquatic Resource Inventory (CARI), to estimate the extent of riparian areas for different sets of riparian functions. RipZET can be run on entire watersheds or selected wetlands and stream reaches. The modules can be run separately or together. The output consists of measures of riparian area for each set of riparian functions, and can be easily converted to measures of area per riparian width class. The contributions of each stream type (i.e., natural or unnatural channels of each stream order) and wetland type to the total riparian area for each set of functions can also be determined. Required input data are a digital elevation map (DEM) and a vegetation map, such as Veg CAMP, or CalVeg. RipZET can accommodate custom DEMs and vegetation maps.
- National Hydrography Dataset
- California Natural Diversity Database
Level 2 (L2). L2 includes data, indicators, and methods for rapid field assessments of wetlands and streams. Rapid assessments typically require less than a day to apply at least once, and do not rely on the collection of field materials or any laboratory analysis. Most L2 methods are qualitative or semi-quantitative. Examples of L2 methods are described below.
- Proper Functioning (PFC). PFC is a qualitative method for assessing the condition of riparian areas. The term refers to both the assessment process and the condition assessment. PFC provides a consistent approach for considering riparian hydrology, vegetation, and erosion or deposition. PFC assessments indicate how well a riparian area is functioning as a physical system, meaning its resiliency to erosive runoff, instream flow, waves, winds, and land use practices, such as grazing and vegetation management.
- California Rapid Assessment Method (CRAM). CRAM is a cost-effective and scientifically defensible rapid assessment method for monitoring the conditions of wetlands and streams throughout California. It is designed for assessing ambient conditions within watersheds, regions, and throughout the State. It can also be used to assess the performance of projects. CRAM enables trained practitioners to assess the overall health of a wetland by choosing the best-fit set of narrative descriptions of observable conditions ranging from the worst commonly observed to the best achievable for the stream or wetland type being assessed. CRAM is supported by a training program with multiple classes each year, a statewide database of practitioners and CRAM results for online queries and visualization available in California EcoAtlas.
Level 3 (L3). L3 includes field data to quantify one or more aspects of aquatic resource condition or stress, relative to other aspects, or per unit time or space. L3 data may include any measures of specific ecosystem parameters, including physical, chemical, and biological data. WRAMP requires that L3 data be collected using appropriate procedures and methods, such as the standardized survey protocols used by state and federal wildlife agencies to monitor and assess fish and wildlife habitats and populations, plant community composition, noxious weed surveys, and similar survey protocols.
- The SWAMP of the State Water Resources Control Board provides access to many L3 methods relating to the water quality of wetlands and streams. SWAMP has created a Quality Assurance (QA) program, developed standardized data storage system, created Standard Operating Procedures (SOPs) for sampling, and continues to create a water quality indictor list. Example SWAMP tools for wetland or stream monitoring include the following.
- Standard Operating Procedures (SOP) for Collection of Macroinvertebrates, Benthic Algae, and Associated Physical Habitat Data in California Depressional Wetlands. This SOP provides detailed instructions on how to sample macroinvertebrates and algae assemblages, water and sediment chemistry, and physical habitat within and adjacent to freshwater depressional wetlands.
- California Stream Condition Index (CSCI). The CSCI is a biological index of stream health that compares the observed local conditions of wadeable streams and the regional, least-stressed condition of comparable streams based on benthic macro-invertebrate community structure. In 2014, the first steps were taken by the SWRCB's SWAMP towards full automation of the CSCI scoring tool for general use by multiple agencies and the public. The models and algorithms for scoring biological condition at sampling sites were written into a downloadable package that functions in the open-source statistical program R. The ultimate goal and next step is to provide a web-based interface so that users can provide geographic coordinates for each sampling site in conjunction with benthic macroinvertebrate data and get an automated output of CSCI scores. Further information about CSCI can be found on the following links.
- Southern California Coastal Water Research Project presentations on CSCI (An Introduction to the California Stream Conduction Index, and Bioobjectives Scoring Tool: California Stream Condition Index)
- Visualization of CSCI results on California Sustainability Website
- Geospatial Data Downloads of CSCI data on California Sustainability Website
Step 6: Sampling Plan
Once the monitoring methods have been selected, a plan of data collection must be developed. As stated under Step 5, every monitoring plan should maximize the use of existing data, and the collection of new data should focus on L1 and L2. The collection of relatively expensive L3 data should be carefully rationalized.
The WRAMP toolset supports targeted sample designs, which use fixed sampling sites, random designs, which draw sampling sites at random from a population of possible sites within the geographic scope of the monitoring and assessment effort, and probabilistic designs, which account for the probability and any candidate site being included in a random sample. The WRAMP Toolset also supports exhaustive surveys of wetland and stream condition, which consist of assessments of every wetland or stream within a prescribed survey area. The best choice in sampling design can depend on the driving concerns and geographic scope. USEPA provides online help in choosing sampling designs.
For driving questions and decisions that can be addressed with L1 data, an exhaustive survey is often most appropriate. Budget constraints usually preclude exhaustive surveys using L2 or L3 methods, unless the scope of the survey is small. A targeted design is required to track changes in condition for fixed sites, such as reference sites, over time. Concerns about the overall condition of aquatic resources for large areas are usually best addressed using a probabilistic sampling design. USEPA provides online help with probabilistic designs for aquatic resources.
Sampling designs should consider the need to calibrate data collection methods and to train monitoring personnel. Careful control of systematic error is a hallmark of successful monitoring.
Step 7: Information Development
This is the most technically demanding and expensive element of the WRAMP Framework. It involves archiving maps of projects and sampling sites, data collection, and data analysis and interpretation. Each of these activities requires careful attention to many details that differ from one monitoring and assessment effort to another. Only the most basic aspects of the activities are noted below.
- Archiving Projects and Sampling Sites. Digital maps of the projects and ambient monitoring sample sites should be uploaded to the Project Tracker using the Project Uploader in California EcoAtlas. Sample sites can be represented as dots, but each project should be represented by a polygonal map of its boundaries. Projects that consist of multiple disjoined areas can be represented by multiple polygons. The locations of sample sites within projects do not have to be mapped. The dots that represent ambient sample sites, and the polygonal maps of projects can serve as interactive repositories for monitoring and assessment data and reports (Steps 8 and 9).
- Data Collection. All data should be collected as planned in WRAMP Steps 3-6.
- Data Analysis and Interpretation. The procedures for data QAQC and analysis (Step 4) should be rigorously implemented. A QAQC report should accompany the finalized data. Data interpretation means translating the data into information that answers the monitoring questions (Step 2), and thusly addresses the Driving Concerns (Step 1). Interpretation can be aided by the advice and review of an independent third party, such as a technical advisory committee. If the monitoring results do not provide an adequate assessment (i.e., if they cannot answer the monitoring question or address the Driving Concerns), the monitoring plan will need to be revised beginning with Step 1 of the WRAMP Diagram.
Step 8: Results and Assessment
The monitoring results will consist of the finalized project and sample site maps, the finalized data, and a report detailing the other outputs of WRAMP Steps 1-7. All of these outputs for one monitoring period or cycle comprise an assessment.
The results should be formatted to directly address the driving regulatory or management question or decision. If the purpose of the assessment is to answer a question, a finding of yes or no is ideal, with a clear presentation of the supporting evidence. If the answer is uncertain, the likelihood of yes or no should be explained, based on the monitoring results. Equivocal findings should be appended with recommendations to revise the monitoring plan to increase the certainty of its findings. This can involve revising any of the outputs from WRAMP Steps 1-7. If the purpose of the assessment is support a decision, its findings must be formatted to fit neatly into the decision process. For example, the findings could be a narrative, one or more graphs or formulas, or a table of numerical values. Formatting the assessment to fit the decision process can involve input from the decision makers.
Step 9: Storage and Delivery
The finalized data sets and assessment report should be uploaded into the interactive repositories in California EcoAtlas that were created by uploading the project map or ambient sample site maps into Project Tracker (Step 7). Water Quality data collected using protocols provided by the Surface Water Ambient Monitoring Program (SWAMP) can be uploaded into the CEDEN. Other datasets should be uploaded as digital flat files from a word processor program, such as Word, or from a spreadsheet program, such as Excel. This makes the monitoring data and assessment report readily accessible to the public through simple spatial queries using EcoAtlas, or by querying the online Project Tracker database. Project Tracker can also be used to deliver the finalized datasets and assessment reports to clients, sponsors, and other interests.
An optional approach to uploading datasets and reports directly to Project Tracker is to enable the Project Tracker to access them from a separate internet server using web services. Web services provide a standard means of interoperating between software applications running on a variety of platforms and frameworks. One advantage of using web services is that the datasets and reports can be delivered through Project Tracker without having to exist within the Project Tracker database. The Landscape Profile Tool of the California EcoAtlas uses web services to access data from a variety of sources, including CEDEN. For delivering monitoring data and assessment reports through Project Tracker using web services, contact the EcoAtlas development team.
Step 10: Driving Concerns
The final Step in the WRAMP Diagram is to consider how well the assessment has addressed the Driving Concerns (Step 1), if they need to be revised, and to determine if there are new concerns that need to be addressed through monitoring and assessment using WRAMP.